Pulse provides a variety of different views to help you monitor Geode clusters, members, and regions.
The following sections provide an overview of the main Pulse views:
Cluster View
The cluster view is a high-level overview of the cluster. It is displayed immediately after you log into Pulse. Information displays around the perimeter of the cluster view show statistics such as memory usage, JVM pauses, and throughput. You can use the cluster view to drill down into details for individual members and regions in the cluster.
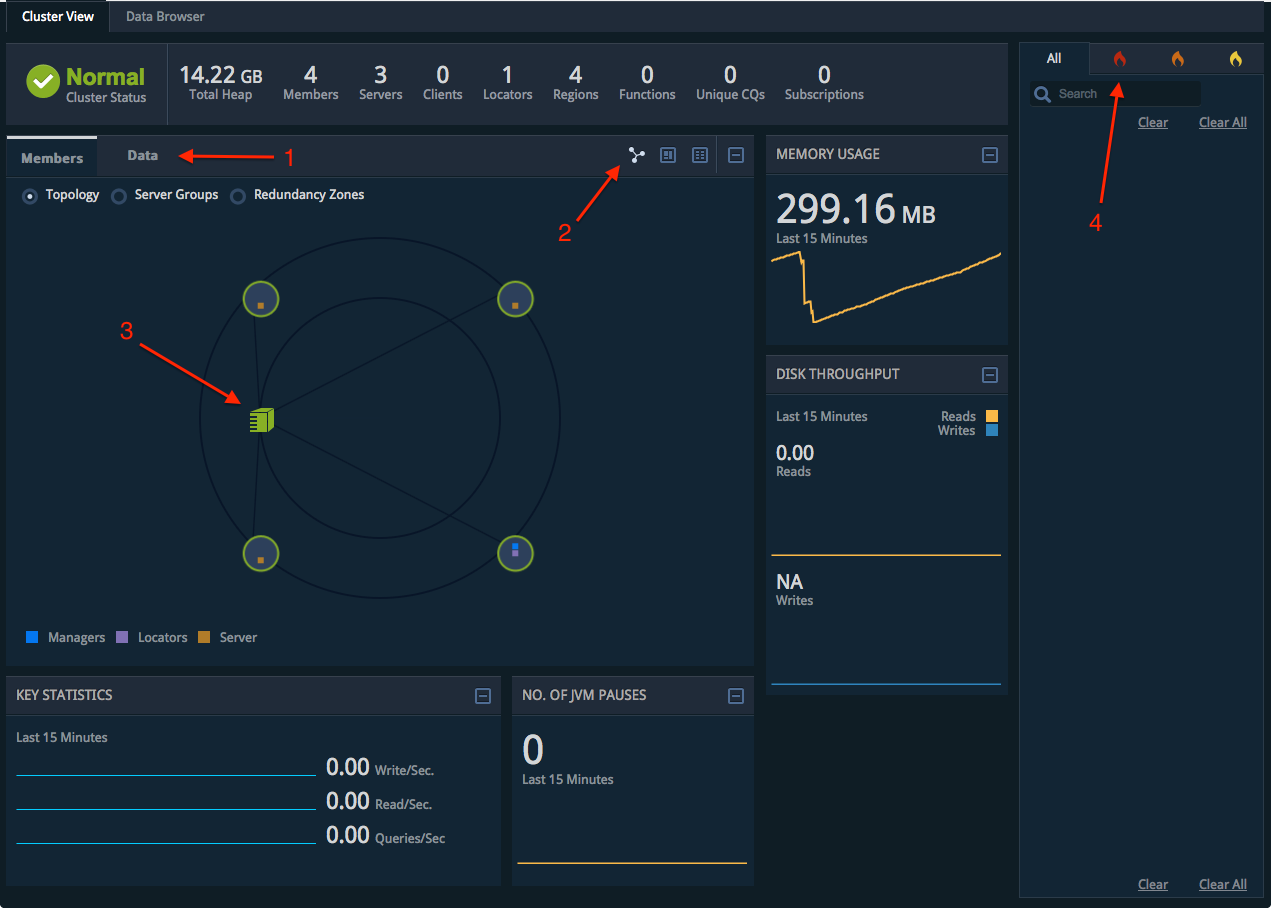
Use these basic controls while in Cluster view:
-
Click Members or Data to display information about Geode members or data regions in the cluster.
-
Click the display icons to display the Geode members using icon view, block view, or table view. Note that icon view is available only when displaying Members.
For example, the following shows Geode Members displayed in table view:
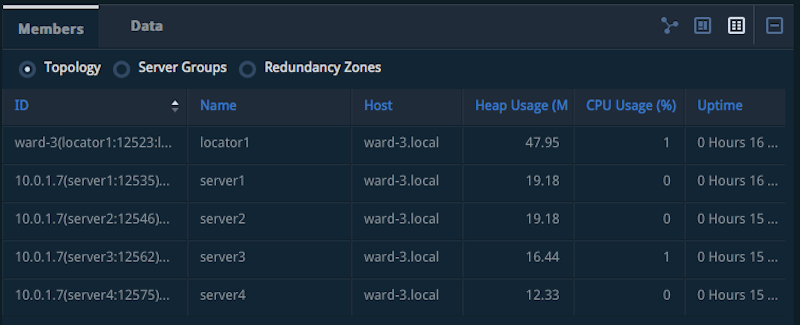
- While in block view or table view, click the name of a Geode member to display additional information in the Member View.
- Click Topology, Server Groups, or Redundancy Zones to filter the view based on all members in the topology, configured server groups, or configured redundancy zones. The following shows Geode Regions displayed in table view:
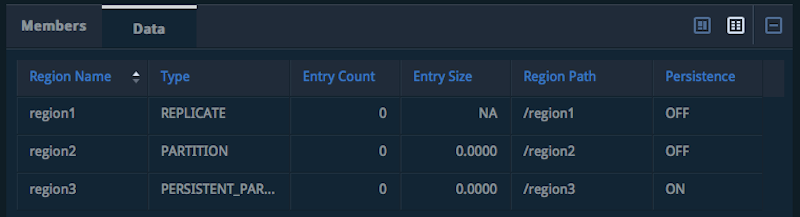
- While in block view or table view, click the name of a Geode region to display additional information in the Region View.
-
While in icon view, click a host machine icon to display the Geode members on that machine.
-
In the Alerts pane, click the severity tabs to filter the message display by the level of severity.
Cluster View Screen Components
The following table describes the data pieces displayed on the Cluster View screen.
| Screen Component | Description |
|---|---|
| Cluster Status | Overall status of the cluster being monitored. Possible statuses include Normal, Warning, or Severe. |
| Total Heap | Total amount of memory (in GB) allocated to the Java heap across all members. |
| Members | Total number of members in the cluster. |
| Servers | Total number of servers in the cluster. |
| Clients | Total number of clients in the cluster. |
| Locators | Total number of locators in the cluster. |
| Regions | Total number of regions in the cluster. |
| Functions | Total number of functions registered in the cluster. |
| Unique CQs | Total number of unique CQs. Corresponds to the UNIQUE_CQ_QUERY statistic. |
| Subscriptions | Total number of client event subscriptions. |
| Cluster Members | Graphical, block, or table view of the members in the cluster. |
| Topology | Organizes cluster members by DistributedMember ID. |
| Server Groups | Organizes members by server group. If none are configured, all appear under Default. |
| Redundancy Zones | Organizes members by redundancy zones. If none are configured, all appear under Default. |
| Host Machine | Hovering over a machine icon shows: CPU Usage, Memory Usage (MB), Load Avg (Linux loadAverage1, negative if unavailable), and Sockets (open sockets). |
| Member (Graphical View) | Hovering shows: CPU Usage, Threads, JVM Pauses, Regions, Clients, Gateway Sender, Port, GemFire Version. |
| Member (List View) | Displays: ID, Name, Host, Heap Usage, CPU Usage, Uptime, Clients (only if CacheServer). |
| Key Statistics | Key performance measurements for the last 15 minutes. |
| Write/Sec | Number of write operations per second across the cluster. A putAll counts as one write. |
| Read/Sec | Number of read operations per second across the cluster. |
| Queries/Sec | Number of queries executed per second across the cluster. |
| No. of JVM Pauses | Number of JVM pauses in the last five minutes due to GC. |
| WAN Information | Shows WAN connectivity status for gateway senders/receivers (green triangle = reachable). |
| Disk Throughput | Total disk throughput for all disks in the cluster. |
| Alerts View | Displays cluster alerts. |
Member View
When you select an individual Geode member in Cluster View, Pulse displays the regions available on that member, as well as member-specific information such as the configured listen ports.
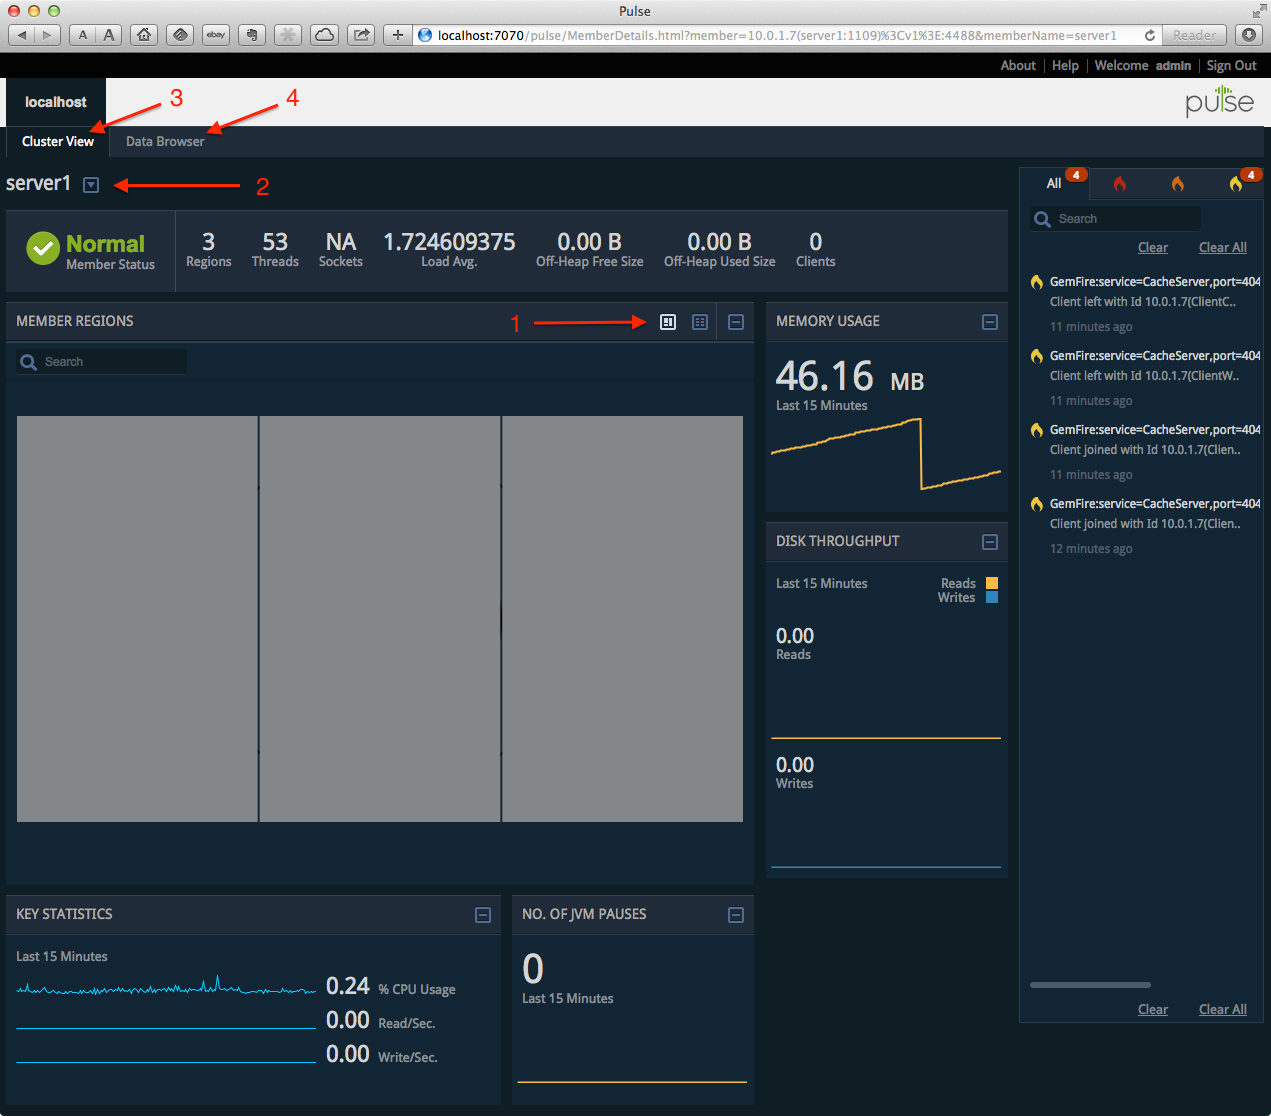
Use these basic controls while in Member View:
- Click the display icons to display regions using block view or table view.
- Use the drop down menu to select a specific member or search for specific members by name.
- Click Cluster View to return to Cluster View. See Cluster View.
- Click Data Browser to query region data. See Data Browser.
Member View Screen Components
The following table describes the data elements displayed on the Member View screen.
| Screen Component | Description |
|---|---|
| Member Status | Overall status of the member being monitored. Possible statuses include Normal, Warning, or Severe. |
| Regions | Total number of regions hosted on the member. |
| Threads | Total number of threads being executed on the member. |
| Sockets | Total number of sockets currently open on the member. |
| Load Avg. | Average number of threads on the member that are in the run queue or waiting for disk I/O over the last minute. Corresponds to Linux loadAverage1. If unavailable, a negative value is shown. |
| Clients | Current number of client connections to the member. |
| Member Regions | Block or table view of regions hosted on the member. |
| Regions (Block View) | Hover shows: Name, Type (REPLICATE, PARTITION, etc.), EntryCount, EntrySize (bytes). For replicated regions, EntrySize is reported only if eviction uses LRU_MEMORY. Partitioned regions include redundant and secondary entries in the size. |
| Regions (Table View) | Displays: Name, Type, EntryCount, EntrySize, Scope, Disk Store Name, Disk Synchronous, Gateway Enabled. |
| Member Clients | Table view showing client details. |
| Member Clients (Fields) | Id, Name, Host, Connected, Queue Size, CPU Usage, Uptime, Threads, Gets, Puts. |
| Key Statistics | Key performance measurements for the member over the last 15 minutes. |
| % CPU Usage | Percentage of CPU used by the member. |
| Read/Sec | Number of read operations per second on the member. |
| Write/Sec | Number of write operations per second on the member. A putAll counts as one write. |
| Memory Usage | Total memory used on the member (MB). |
| No. of JVM Pauses | Number of JVM pauses in the last five minutes due to GC or excessive CPU usage. |
| WAN Information | Displays WAN cluster information (only if gateway senders/receivers are configured). |
| Disk Throughput | Rate of disk writes on the member. |
Region View
The Pulse Region View provides a comprehensive overview of all regions in the cluster:
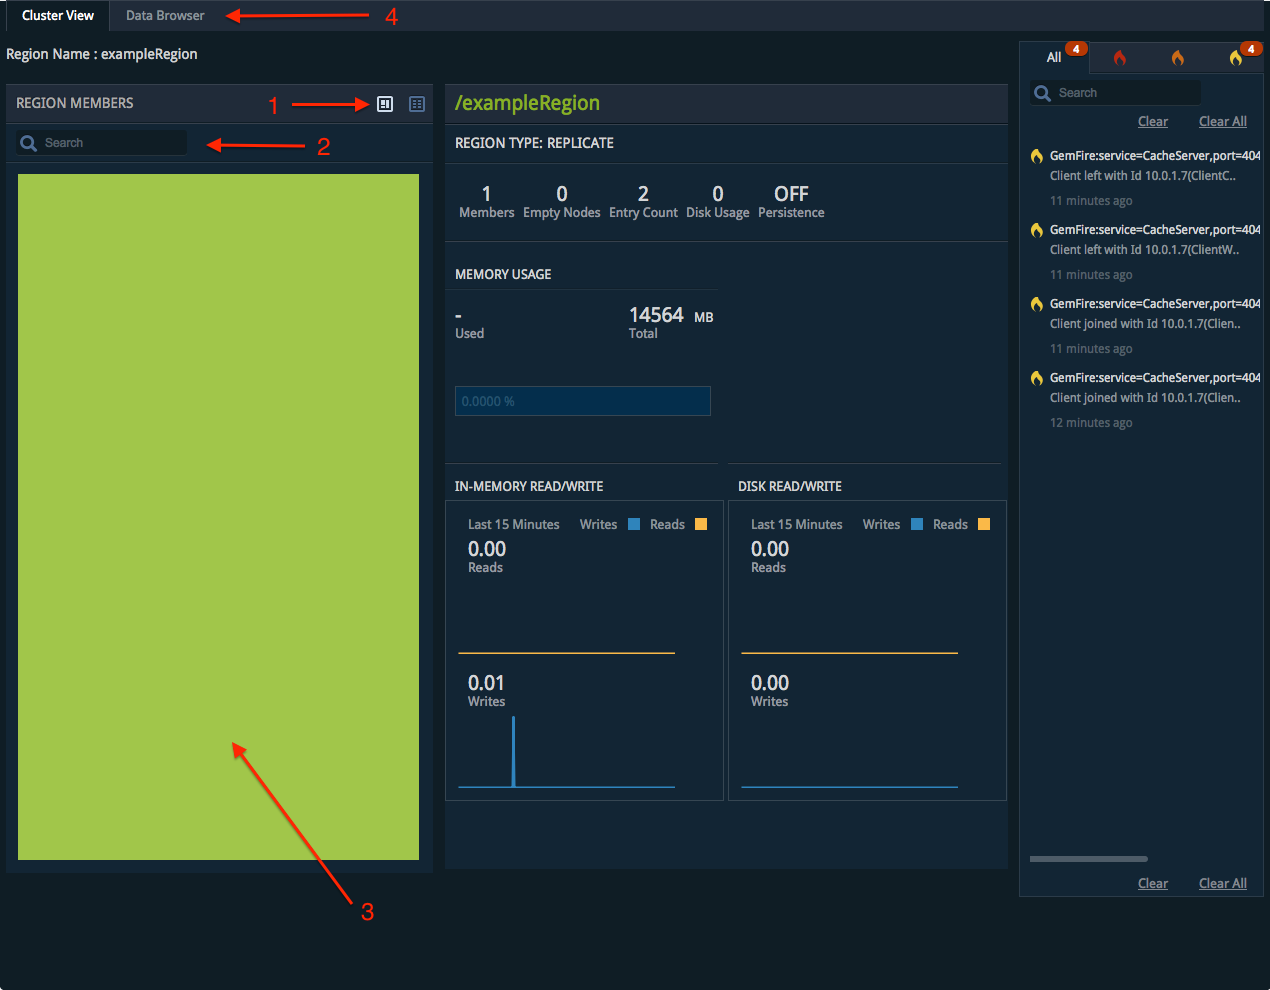
Use these basic controls while in Region View:
-
Click the display icons to display all members that host the region using block view or table view.
(Click the name of a member to change to that member's Member View.)
-
Search for specific members that host the current region.
-
Hover over a member name to display information such as the region entry count, entry size, and throughput on that member.
-
Click Cluster View or Data Browser to go to those screens.
Region View Screen Components
The following table describes the data elements displayed on the Region View screen.
| Screen Component | Description |
|---|---|
| Region Members | Lists members that host the region, shown in block view or table view. |
| Region Member (Detail View) | Hover shows: Member Name, EntryCount, EntrySize (bytes; replicated regions report only with LRU_MEMORY; partitioned regions include redundant and secondary entries), Accessor (whether the member is an accessor), Reads/Writes (last 15 minutes, memory and disk). |
| Region Member (Table View) | Displays: ID (unique member ID), Name (region name), Host (member hostname), Heap Usage (MB), CPU Usage (%), Uptime, Accessor (whether the member is an accessor). |
| Region Detail | Right pane shows region information: Name, Region Path, Type (REPLICATE, PARTITION, etc.), Members (hosting count), Empty Nodes (DataPolicy EMPTY or LocalMaxMemory=0), Entry Count, Disk Usage (persistent data), Persistence (whether data is persisted), Memory Usage (used/total and %), Reads/Writes (last 15 minutes, memory and disk). |
Data Browser
The Pulse Data Browser enables you to query region data. Note that there are two key attributes available on DistributedSystemMXBean (see List of Geode JMX MBeans) that you can use to configure limits for the result sets displayed in Data Browser:
QueryResultSetLimitlimits the number of rows that Data Browser queries return. 1000 rows are displayed by default.QueryCollectionsDepthlimits the number of elements of a collection that Data Browser queries return. This attribute applies to query results contain collections such as Map, List, and so forth. The default value is 100 elements.
See the org.apache.geode.management.DistributedSystemMXBean JavaDocs for information on available MBean methods and attributes.
The following shows an example Data Browser view:
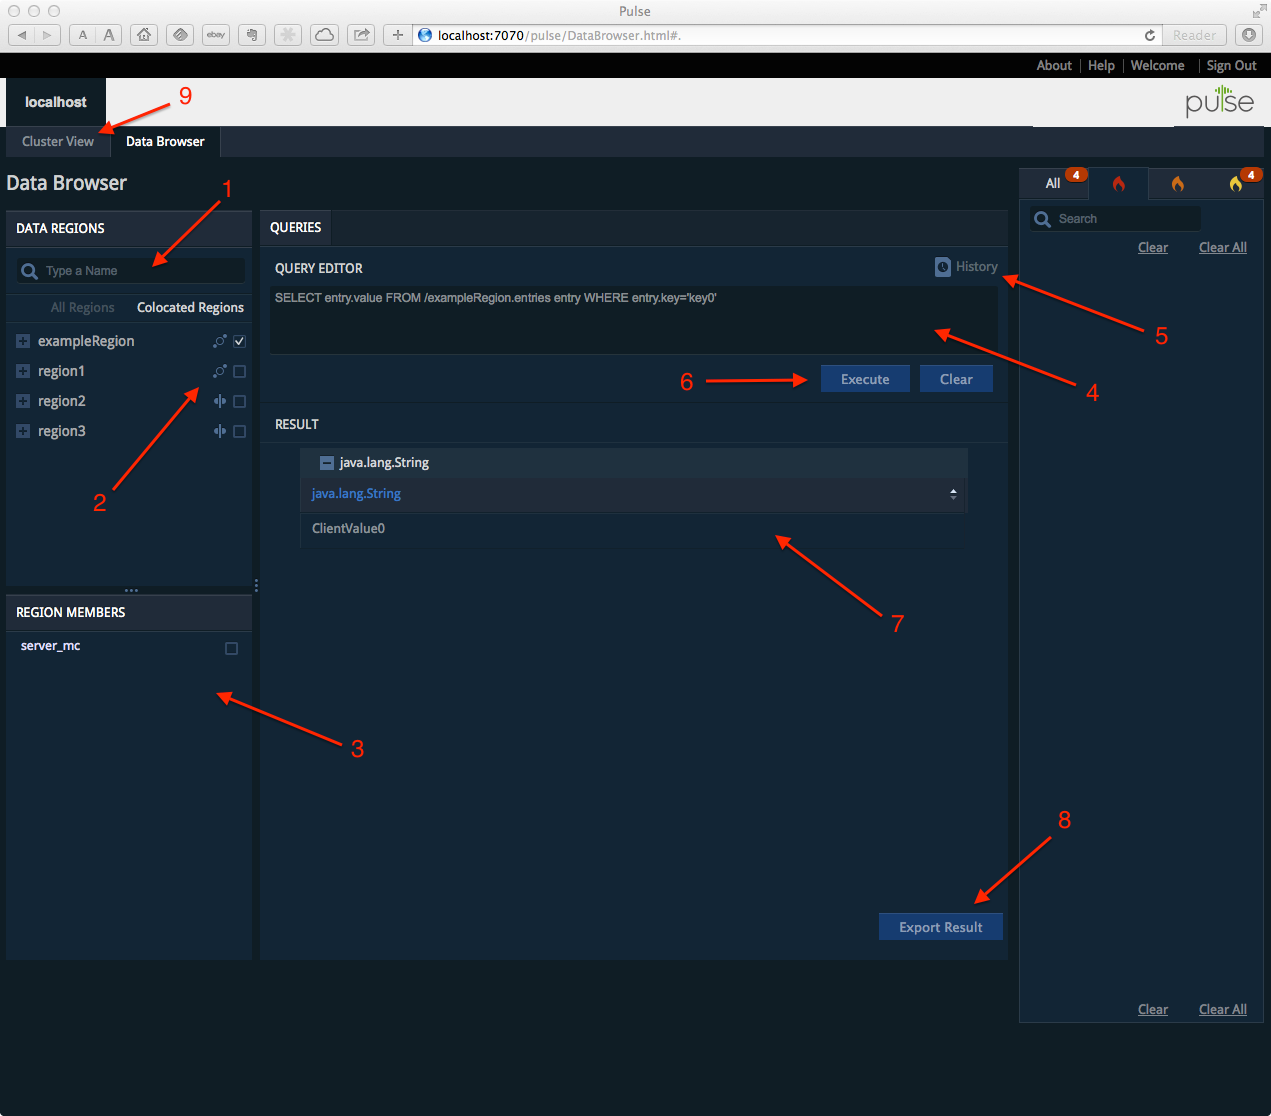
Use these basic controls while in Data Browser view:
- Search for the name of a specific region.
- Select one or more regions to display the Geode members that host those regions. The hosting Geode members appear in the Region Members section.
- Select one or more members from the Region Members section to restrict query results to those members.
- Type in the text of a query to execute. See Querying.
- Display a list of previously-executed queries. Double-click on a query from the history list to copy it to the Query Editor, or delete the query from your history.
- Execute your query or clear the contents of the Query Editor.
- View the current query results.
- Export the query results to a text file.
- Return to Cluster View.
Alerts Widget
The Alerts Widget appears in the right portion of the screen and displays a list of alerts.
The alerts displayed for the cluster appear based on the alertLevel field set in the DistributedSystemMXBean. By default, log messages with the level of SEVERE are shown as alerts. You can modify the level by using the DistributedMXBean.changeAlertLevel method. See System Alert Notifications for more information.
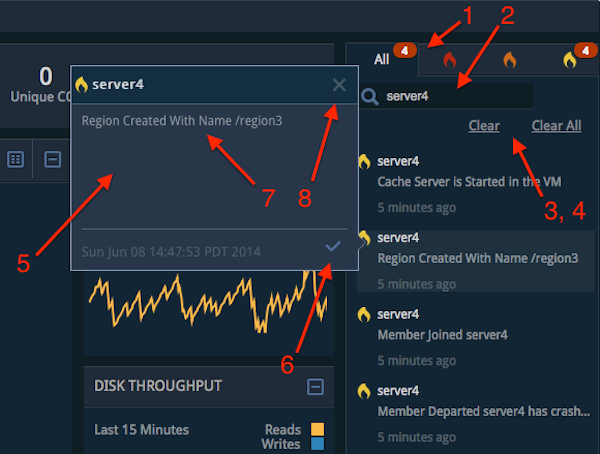
Use these basic controls in the Alerts Widget:
- Select an alert level to view only alerts with a specific severity.
- Enter text in the search box to filter the list of alerts.
- Select an alert and click Clear to remove it from the alert list.
- Click Clear All to remove all alerts from the widget.
- Double-click an alert to open a pop-up window that displays the full text of the alert message.
- Click the check mark in an alert pop-up window to acknowledge the alert. Acknowledged alerts display a check mark in the list of alerts.
- Triple-click the alert in the pop-up or in the alert list to select the message text. You can then copy and paste the text into another application.
- Click the X to close the pop-up alert window.